Analysis Menu
The Analysis Menu is available from the Evaluation Page. This menu provides commands for the analysis of alternatives. Each command creates and previews a corresponding analysis report.
DEXiWin facilitates four analyses:
 Selective explanation: Displays particularly
strong and weak values of the currently selected alternative. This method
finds and displays all connected subtrees of attributes whose values are
either all of a ‘good’ (for strong points) or ‘bad’ category (for weaknesses).
Before making the report, DEXiWin displays the Report parameters
dialogue in which it is possible to define: the root attribute for selective explanation,
the selection of attributes to be included in the report, considered alternatives and
general report format settings.
Selective explanation: Displays particularly
strong and weak values of the currently selected alternative. This method
finds and displays all connected subtrees of attributes whose values are
either all of a ‘good’ (for strong points) or ‘bad’ category (for weaknesses).
Before making the report, DEXiWin displays the Report parameters
dialogue in which it is possible to define: the root attribute for selective explanation,
the selection of attributes to be included in the report, considered alternatives and
general report format settings.
 Plus/Minus Analysis: This analysis investigates the effects
of changing each basic attribute by one or more values down and/or up, if possible,
independently of other attributes. By default, the analysis is carried out for the
currently selected alternative and displays the effects of changes on the
currently selected aggregate attribute.
Before making the report, DEXiWin displays the Report parameters
dialogue with possible selections of: the root (target) attribute of the analysis,
the considered alternative, the maximum number of value steps in each direction,
the selection of attributes to be included in the report, and
general report format settings.
Plus/Minus Analysis: This analysis investigates the effects
of changing each basic attribute by one or more values down and/or up, if possible,
independently of other attributes. By default, the analysis is carried out for the
currently selected alternative and displays the effects of changes on the
currently selected aggregate attribute.
Before making the report, DEXiWin displays the Report parameters
dialogue with possible selections of: the root (target) attribute of the analysis,
the considered alternative, the maximum number of value steps in each direction,
the selection of attributes to be included in the report, and
general report format settings.
 Compare alternatives: This command creates a report
that is similar to the common Evaluation results report,
except that it highlights differences between alternatives.
In the dialogue, which is shown before making the comparison, you can choose:
the primary alternative, whether or not to show comparison operators,
the list of secondary alternatives, the list of attributes to be considered,
and general report format settings. On this basis, DEXiWin makes a report in which it
compares the primary alternative with each secondary one.
Primary alternative values are displayed in full, whereas the secondary alternatives’
values are displayed only when different from the primary ones.
When showing comparison operators, displayed secondary values are prefixed with operators
‘<’, ‘<=’, ‘=’, ‘>=’, ‘>’ and ‘?’. They represent the preferential comparison relation
between the primary and each secondary alternative’s value. ‘?’ denotes that values are incomparable.
The operators ‘<=’ and ‘>=’ denote “weak preferences”: even though
the primary and secondary values are equal, the evaluations on lower levels are different
and indicate a possible preferential difference.
Compare alternatives: This command creates a report
that is similar to the common Evaluation results report,
except that it highlights differences between alternatives.
In the dialogue, which is shown before making the comparison, you can choose:
the primary alternative, whether or not to show comparison operators,
the list of secondary alternatives, the list of attributes to be considered,
and general report format settings. On this basis, DEXiWin makes a report in which it
compares the primary alternative with each secondary one.
Primary alternative values are displayed in full, whereas the secondary alternatives’
values are displayed only when different from the primary ones.
When showing comparison operators, displayed secondary values are prefixed with operators
‘<’, ‘<=’, ‘=’, ‘>=’, ‘>’ and ‘?’. They represent the preferential comparison relation
between the primary and each secondary alternative’s value. ‘?’ denotes that values are incomparable.
The operators ‘<=’ and ‘>=’ denote “weak preferences”: even though
the primary and secondary values are equal, the evaluations on lower levels are different
and indicate a possible preferential difference.
 Target analysis: Tries to find combinations of
input values that either improve or degrade the selected output
value of the currently selected alternative. In comparison with selective
explanation, which considers only changes of a single attribute at a time,
target analysis performs an exhaustive combinatorial search
for multi-value changes of multiple input attributes.
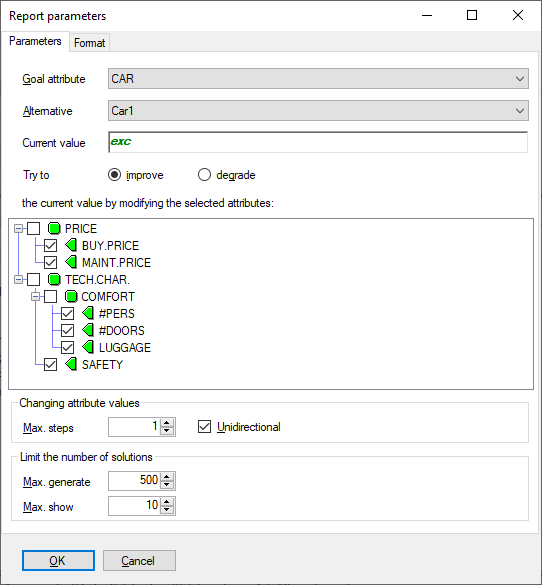
Before making a report, DEXiWin displays the Report parameters
dialogue in which you can define:
Target analysis: Tries to find combinations of
input values that either improve or degrade the selected output
value of the currently selected alternative. In comparison with selective
explanation, which considers only changes of a single attribute at a time,
target analysis performs an exhaustive combinatorial search
for multi-value changes of multiple input attributes.
Before making a report, DEXiWin displays the Report parameters
dialogue in which you can define:
Goal attribute and Alternative to be considered.
Try to: Direction of the analysis, that is whether to improve or degrade the current value.
Selection of attributes whose values are modified in the analysis.
Max. steps: The maximum number of value steps to be checked at all the selected attributes.
Unidirectional: When enabled, only unidirectional value changes are checked, i.e., only up when trying to improve the goal value and only down when degrading. Notice that with disabled Unidirectional setting, the goal value can be improved by improving values of some attributes, while at the same time degrading values of some other attributes. The latter is often not interesting nor desired.
Max. generate: Maximum number of generated solutions. Target analysis involves a combinatorial search algorithm that may eventually generate a huge number of solutions. This parameter limits the search to a reasonable number and reduces the execution time.
Max. show: Maximum number of solutions shown in the report. This parameter further limits the number of solutions that are actually included in the report.
 Qualitative-Quantitative evaluation: Displays results of
Qualitative-Quantitative
evaluation of alternatives. Each evaluation result is represented by an
offset value,
which consists of a qualitative value and a numeric offset in the range [-0.5, +0.5].
Numeric offsets are determined using the QQ2 method.
The higher the numeric offset, the better the evaluation relative to other
evaluations of the same attribute.
Qualitative-Quantitative evaluation: Displays results of
Qualitative-Quantitative
evaluation of alternatives. Each evaluation result is represented by an
offset value,
which consists of a qualitative value and a numeric offset in the range [-0.5, +0.5].
Numeric offsets are determined using the QQ2 method.
The higher the numeric offset, the better the evaluation relative to other
evaluations of the same attribute.
See also
Example analyses carried out using the Car Evaluation and Employee Selection models.