Function Chart: Advanced Displays
The Advanced tab provides some additional graphic displays of the function. One or more graphic overlays can be selected that show possible numeric interpretations of the function.
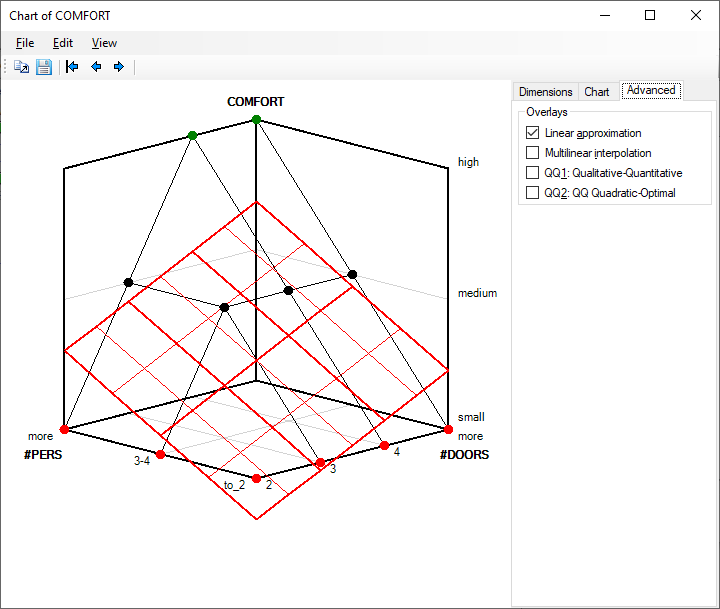
Linear approximation
This graphic overlay shows the (hyper)plane that best (in the least-squares sense) approximates individual points (elementary rules) of the function. Notice that this (hyper)plane is used to determine weights that are used in the Weight Editor
Multilinear interpolation
Multilinear interpolation extends discrete function points to a continuous multivariate function that exactly matches those points and smoothly interpolates the space around them. This function is constructed using the multivariate interpolation method.
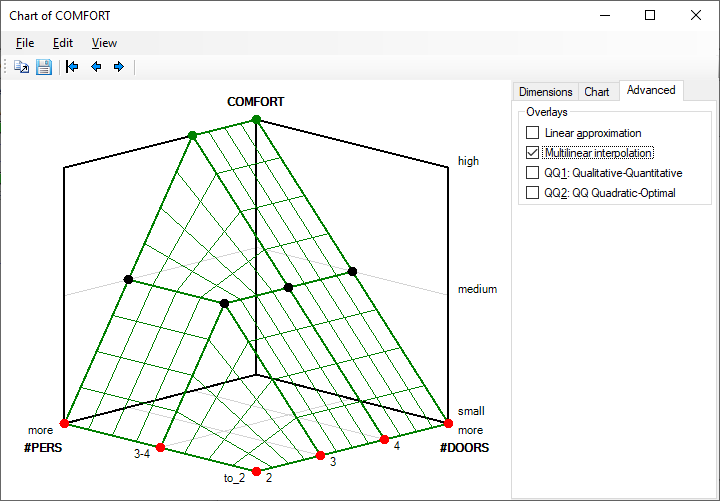
Multilinear intepolation just illustrates a possible way of extending discrete DEX function to a continuous space. It is not used in any of DEX evaluation methods.
Qualitative-Quantitative (QQ1)
QQ (Qualitative-Quantitative) is a method suggested by Bohanec, et al. (1992), aimed at extending DEX with numeric evaluation of alternatives that is consistent with the discrete evaluation. The idea is that alternatives are first assigned to distinct qualitative classes and then ranked within each class. The numerical ranking function is derived directly from decision rules and does not require any additional work while defining the rules.
In order to distinguish the original QQ method from a more recent QQ2 method, QQ is consistently called QQ1 in DEXiWin.
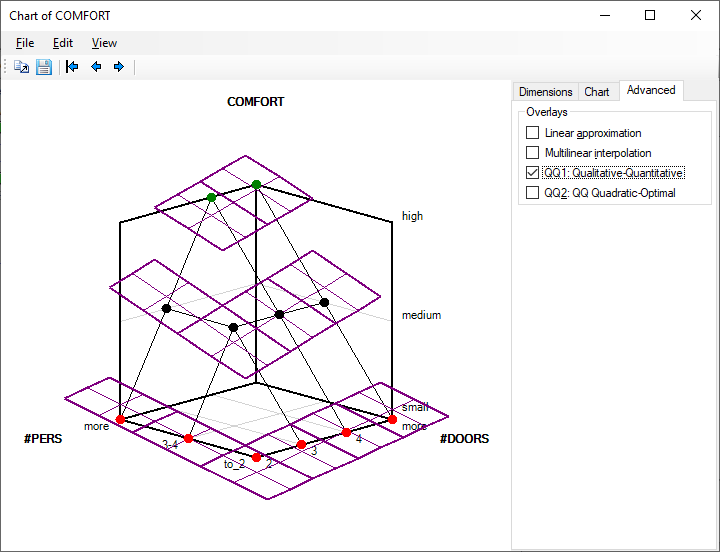
The QQ1 display shows the numerical ranking function derived from rules. Each point is surrounded by a small hyperplane covering the [-0.5, +0.5] range around the point. The hyperplanes are slanted according to function weights and extended vertically to cover the whole [-0.5, +0.5] range of each discrete class.
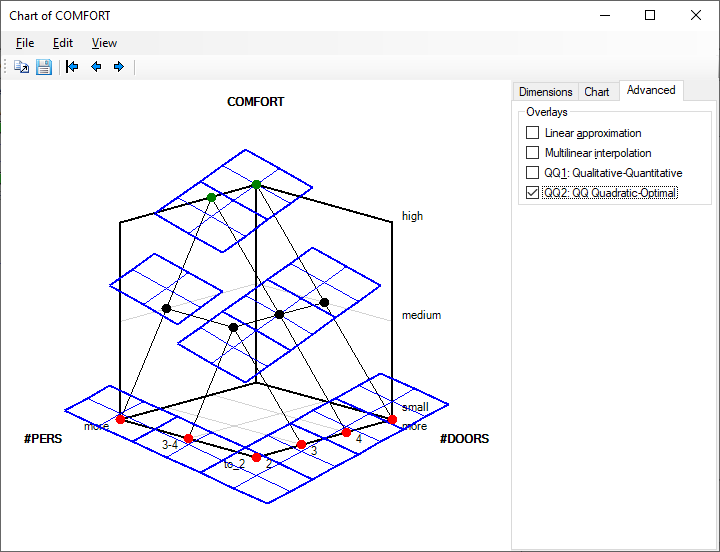
Quadratic-Optimal (QQ2)
QQ2 is a new method, designed for the same purpose as QQ1, but aimed at improving some of QQ1’s deficiencies. While QQ1 relies on attribute weights, QQ2 considers only the principle of dominance, which makes it more general and flexible. In order to construct hyperplanes around points of the function, QQ2 solves a quadratic optimization program, generally achieving a better vertical discrimination of ranks than QQ1. QQ2 also correctly handles unordered attributes. In this way, QQ2 is considered better than QQ1. The QQ2 method has not been published yet.
Remarks
Linear approximation and QQ1 are available only for functons that allow using weights, i.e., are defined in the space of preferentially ordered attributes.
Multilinear interpolation is available exclusively to functions that are fully determined, meaning that all their rules explicitly define a single output value.
Linear approximation is used in DEXiWin in relation with weights. Multilinear and QQ1 representations are currently just displayed and not used anywhere else in DEXiWin. QQ2 is used in Qualitative-Quantitative evaluation.
References
Bohanec, M., Urh, B., Rajkovič, V. (1992): Evaluating options by combined qualitative and quantitative methods. Acta Psychologica 80, 67–89.