Reports
Reports provide formatted and mostly textual presentations of key components of the current DEXi model. In DEXiWin, reports can be viewed at different places:
On a Report Page. DEXiWin’s Model Page can contain one or more report pages:
The main Report Page is fixed and is shown at all times; it contains the “main” report associated with the current model.
Zero or more additional report pages, which typically show some specific report elements. These reports are temporary; they can be created interactively and closed when not needed any more.
In a Preview Window, which is displayed after invoking some command, such as one of the analysis commands on the Evaluation Page.
Depending on settings settings, reports are displayed in one of the following ways:
In a Preview Window. The report is shown in a form of a document, which can be viewed page-by-page and exported to text and HTML files. Individual pages can be copied as bitmap or metafile graphics to the clipboard or saved on a file.
In an Internal Browser. The report is shown in the HTML format internally in DEXiWin.
In your default system browser, using the HTML format.
Report Elements
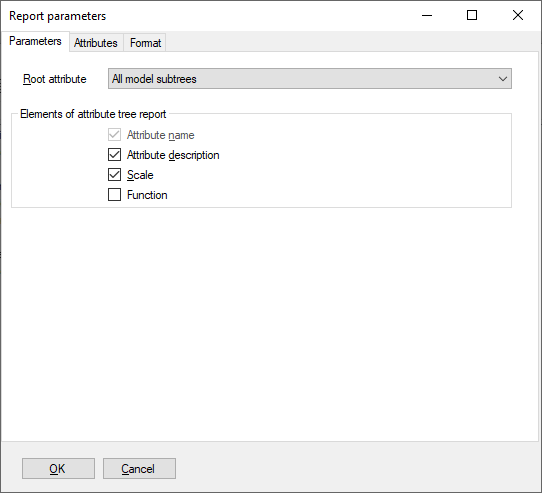
DEXiWin reports consist of zero or more report elements, each of which presents some viewpoint on the contents of the current DEXi model. Each element is associated with specific Report parameters, which define the element’s contents in more detail, for example, which attributes and/or alternatives to consider.
For most of reports other than the main one, whose contents and settings are predefined, the Report parameters window is shown prior to making and displaying the report, so that the detailed settings can be provided in advance. Report parameters of each already displayed element can be edited, too.
The following types of report elements are available in DEXiWin:
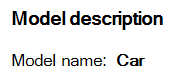
Model description
Name and textual description of the current model, if defined. Example:
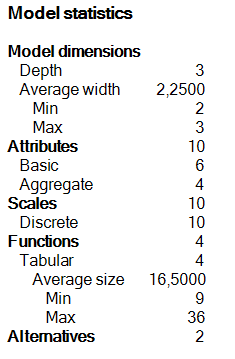
Model statistics
Statistics of the current model and its components. Example:
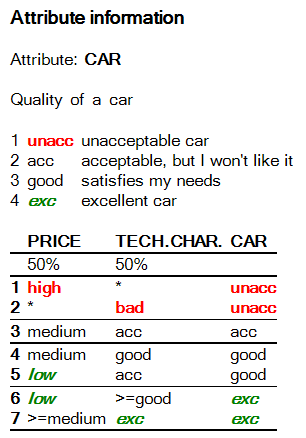
Attribute information
This is a generic report element that traverses the whole model in a depth-first order and displays selected information about each attribute: attribute name, description, scale and/or function. In Report parameters, it is additionally possible to specify the root attribute for traversing the tree, format of aggregation functions display, and the list of considered attributes.
Attribute tree
This is another generic report element that consists of a tree structure of attributes, displayed on the left side, together with one or more columns of information shown on the right. The information is selectable and can contain: attribute description, scale and function summary. In Report parameters, it is additionally possible to specify the root attribute and select attributes to be included in the report.
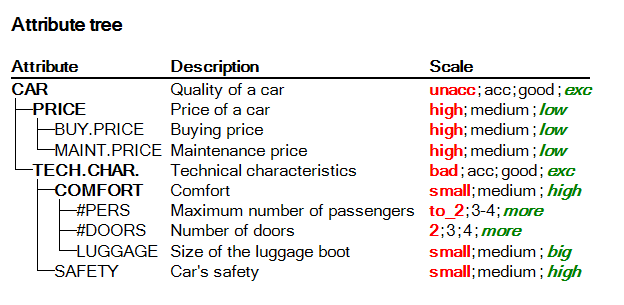
There are three specific instances of Attribute tree, named:
Attribute descriptions: Attribute tree displaying attribute descriptions.
Scales: Attribute tree displaying attribute scales.
Function summary: Attribute tree displaying function summaries.
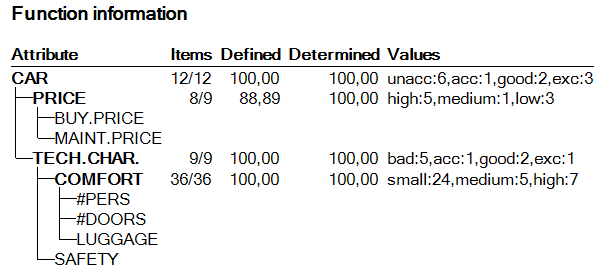
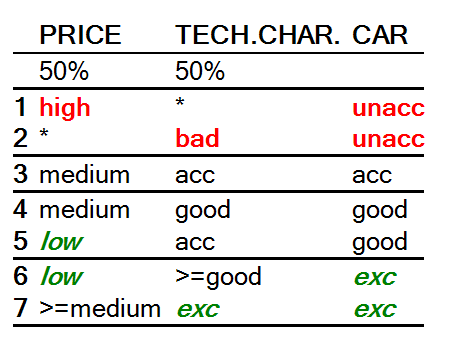
Function information
Similar to Function summary above, but more structured, displaying information about functions in four columns, as shown below.
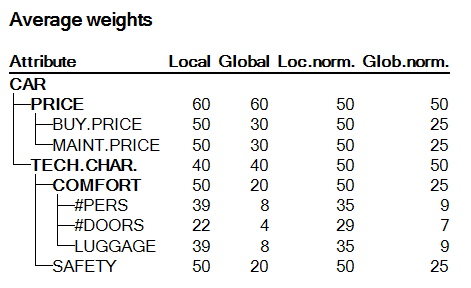
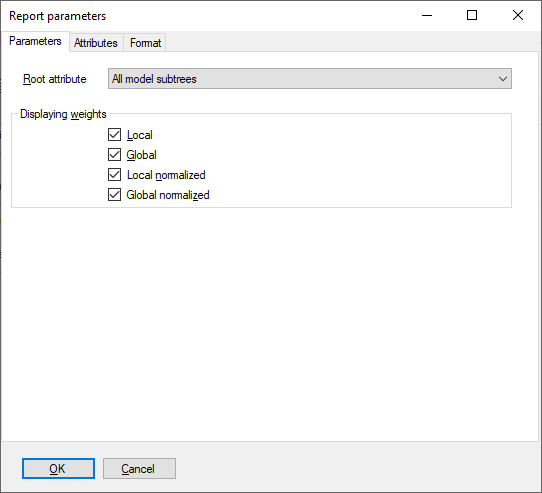
Weights tree
Similar to Attribute tree, but showing weights of attributes. Standard and advanced weights can be selected for display. Additionally, the root attribute and considered attributes can be selected in Report parameters.
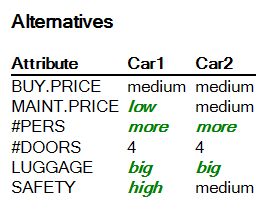
Alternatives
A table of alternatives’ input data. This element shows the list of basic attributes on the left, followed by one or more alternatives, one column per alternative. In Report parameters, it is possible to specify the root attribute, maximum number of data colums per table, and select attributes and alternatives to include in the report. When there are more alternatives than the maximum number of columns, they are displayed in multiple tables.

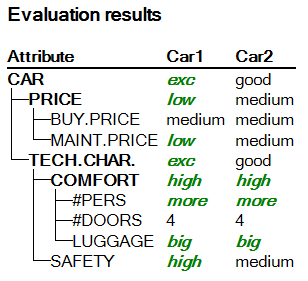
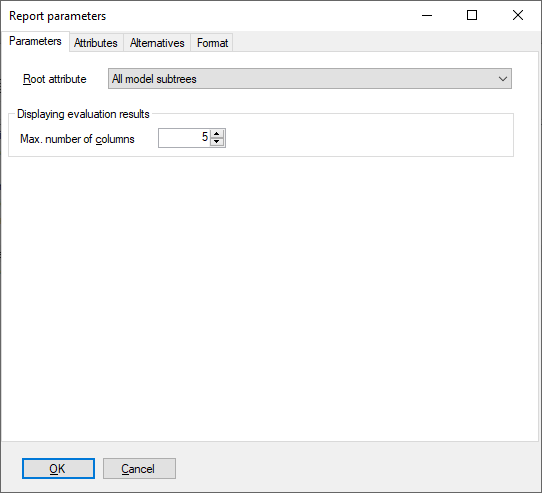
Evaluation results
Results of alternatives’ evaluation, presented in tabular form that is a combination of Attribute tree and Alternatives. An attribute structure on the left is followed by one or more alternatives on the right, one column per alternative. In Report parameters, it is possible to specify the root attribute, maximum number of data colums per table, and select attributes and alternatives to include in the report. When there are more alternatives than the maximum number of columns, they are displayed in multiple tables.
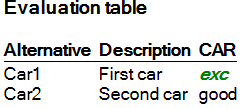
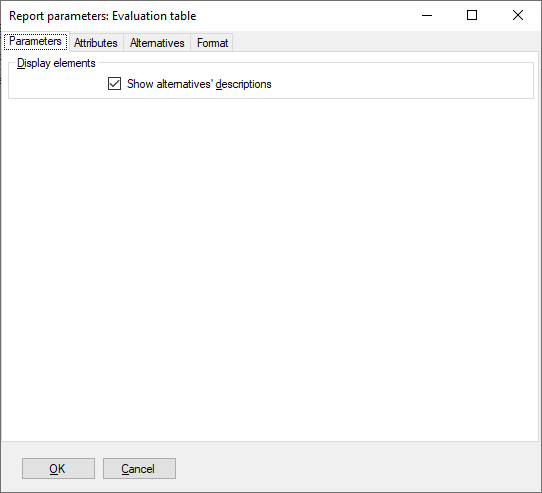
Evaluation table
Evaluation table is a transposed version of Evaluation report: alternatives are shown in rows and attributes in columns. Optionally, a column displaying alteratives’ descriptions can be included. Attribute structure is not shown. In contrast with Evaluation results, only explicitly selected attributes are included in this table. By default, model roots are incuded and all other attributes are excluded.
Function Report Element
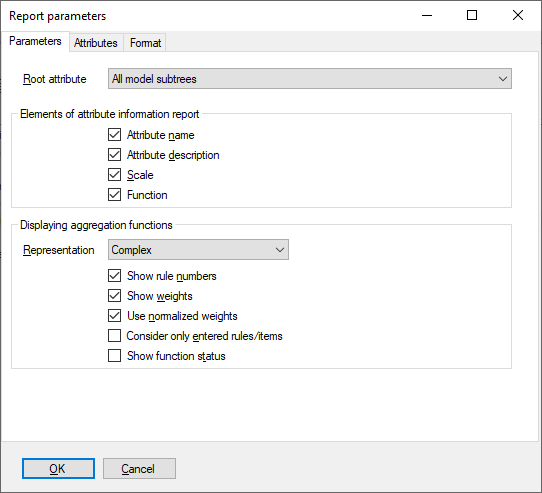
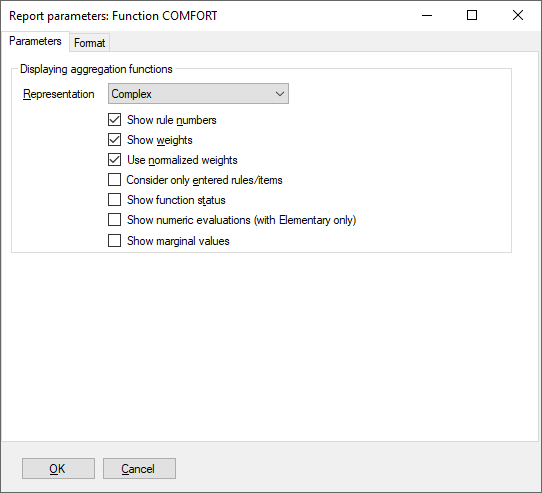
Function report element can be created from the Aggregation Function Editor, invoking the Show Function command. This element shows the currently edited function in one of three representations: with elementary or complex rules, or decision trees. Additionally, Report parameters allow to specify whether or not:
to show rule numbers,
to include attribute weights,
to use normalized weights (instead of local ones),
to display only entered (defined) decision rules,
to show function status, including warnings about inconsistencies and other possible problems in function definitions,
to show numerical evaluations associated with individual elementary rules: Linear approximation, QQ1 and QQ2 (see Advanced Charts); applies only when displaying elementary rules,
to show marginal values: numeric representation of input attributes’ qualitative values, as determined from the corresponding function.
Analysis Report Elements
The following report elements can be created from the Evaluation Page, invoking one of the analysis commands:
Selective explanation: Presenting results of selective explanation: displaying strong and weak points of alternatives. Report parameters allow the selection of the root attribute and the lists of considered attributes and alternatives.
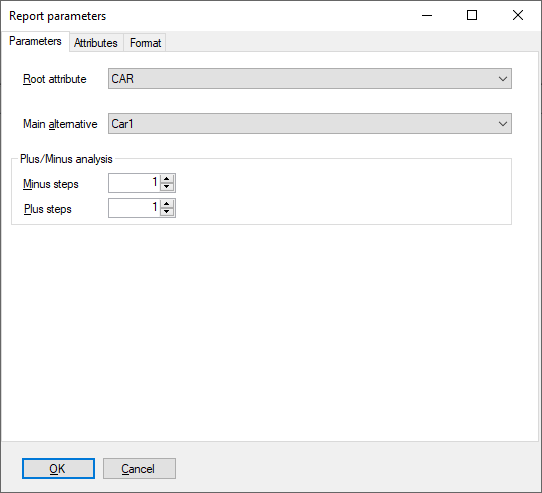
Plus/minus analysis: Results of plus/minus analysis: investigating the effects of changing one attribute at a time. Report parameters allow the selection of: the root attribute, considered alternative, maximum value steps in both directions, and the list of considered attributes.
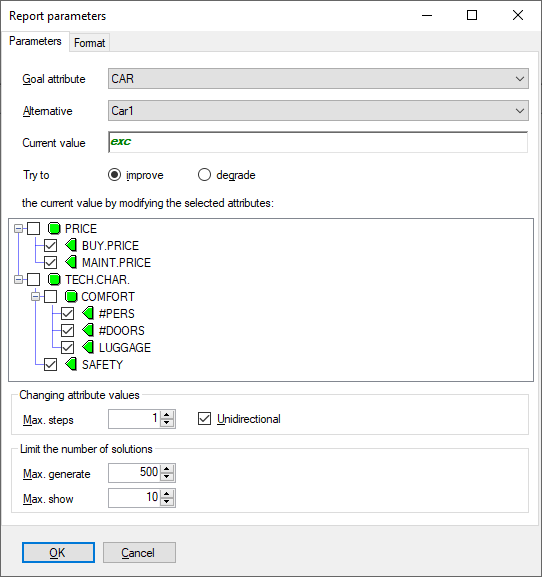
Target analysis: Results of target analysis: try to improve/degrade an alternative by changing multiple attributes. Report parameters allow the selection of: the goal attribute, considered alternatives, search direction (“improve” or “degrade”), the list of considered attributes, maximum number of value steps, whether or not the investigated changes are unidirectional, and the maximum number of generated and displayed solutions.
Compare alternatives: Compare evaluation results of some alternative with others. Report parameters allow the selection of the main alternative, and the lists of other alternatives and attributes to be considered in comparison.
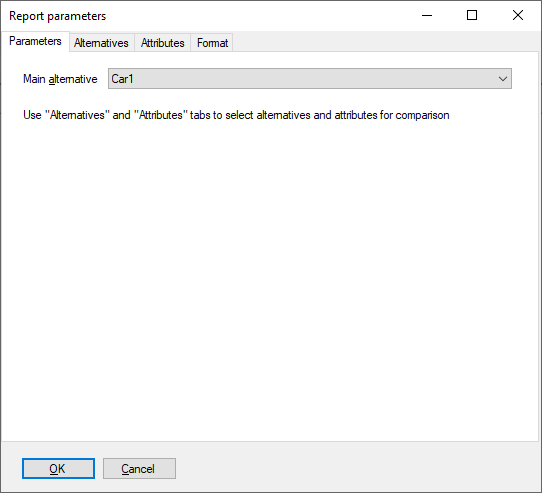
Chart Report Elements
A chart report element can be created from the Charts Page. There, the graphic image of the currently displayed chart can be added to the main report on the Report Page.