Charts Page
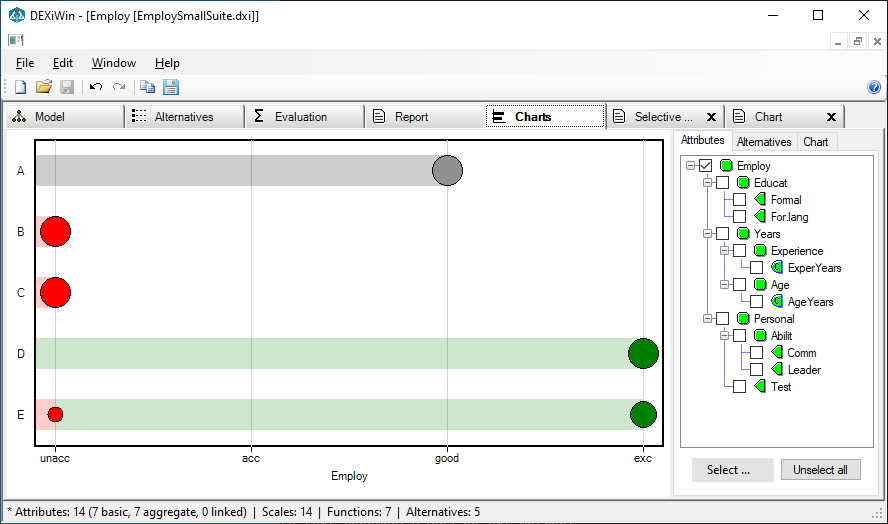
DEXiWin’s Chart Page is used to compose and display charts that show evaluation results, one chart at a time. Chart graphics can be copied to the main report.
Workspace
The workspace consists of a chart display on the left and control area on the right. The latter consists of three tabs:
Attributes: For selecting attributes to be displayed.
Alternatives: For selecting alternatives to be displayed.
Chart: Settings to control chart contents and format.
Attributes Page
The selection of attributes is particularly important, because it largely determines the chart type shown:
No selected attributes: No chart is displayed
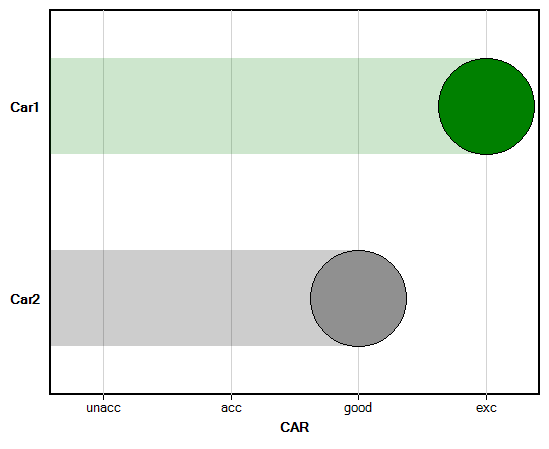
One selected attribute: Bar chart is displayed
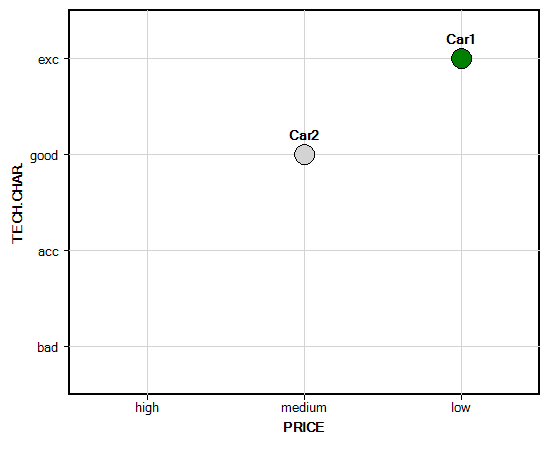
Two selected attributes: Scatter chart is displayed
Three or more selected attributes: One of the following chart variations is displayed:
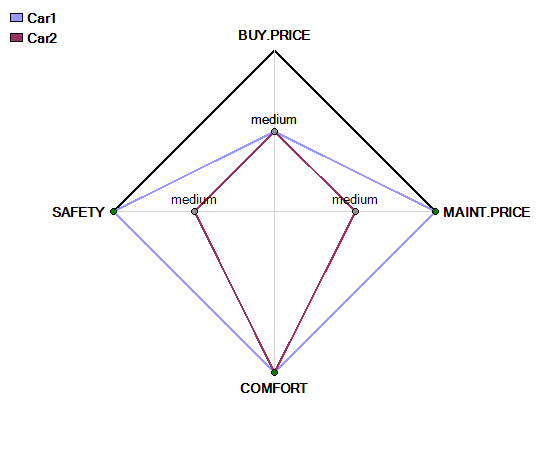
Radar chart: Displaying all alternatives on a single chart
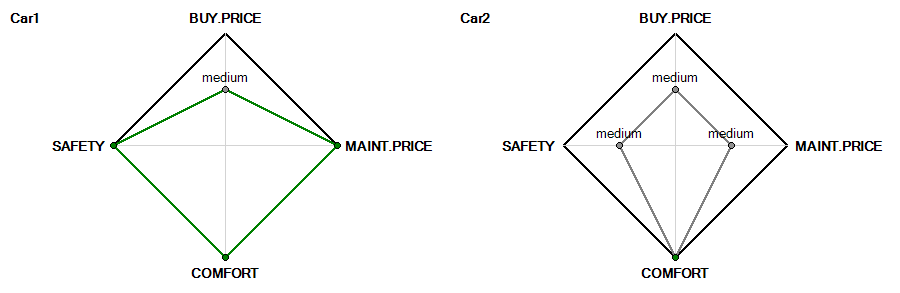
Radar grid: Displaying multiple radar charts, one alternative per chart
Linear chart: Displaying alternatives’ value profiles
In addition to selecting individual attributes in the tree, there are two buttons:
Select …: A drop-down button providing menu items to select: all attributes, basic attributes, root attribute(s) and attributes positioned on the first, second or third level of the tree.
Unselect all: Unselect all attributes.
See examples of charts below.
Alternatives Page
Similarly as for attributes, this page allows selecting and deselecting individual alternatives for display. There are two buttons: to Select all or Unselect all alternatives.
Chart Page
This page provides various settings to control chart contents and format of its components.
The topmost control called Chart type for >2 attributes is essential. It provides three chart-type options that apply in the case when more than two attributes are selected: Radar, Radar grid, and Linear. For Radar grid charts, it provides controls to define horizontal and vertical grid dimensions.
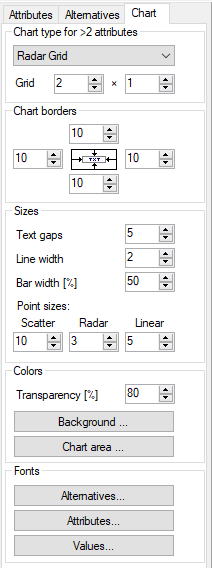
The remaining controls on the Chart Page can be used to set up:
All four Chart borders, in pixels
Sizes of gaps between text items [pixels], line widths [pixels], bar widths [%] and points shown in the scatter, radar and linear charts [pixels]
Colors palette, selected from a collection of predefined palettes
Transparency of filled regions (applies only to interval and distributed values)
Fill colors of Chart area and Background
Fonts used to display Alternatives, Attributes and Values
Commands
To invoke a command, you may either select an item from the main menus, toolbar or right-click and select an item from the pop-up menu.
 File/Save chart…**: Opens a dialogue to save the current chart on a file,
using the metafile (
File/Save chart…**: Opens a dialogue to save the current chart on a file,
using the metafile (.emf) or bitmap (.png) format.
Edit/Add to Report: Adds the current chart as a graphic to the main report on the Model Window.
 Edit/Copy as metafile…: Copies the current chart to the clipboard in metafile format.
 Edit/Copy as bitmap…: Copies the current chart to the clipboard in bitmap format.
Examples of Chart Types
Bar Chart (one attribute selected)
Scatter Chart (two attributes selected)
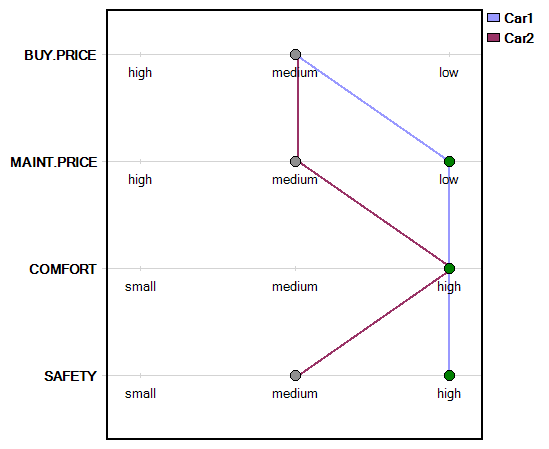
Radar Chart (three or more attributes selected)
Radar Grid Chart (three or more attributes selected)
Linear Chart (three or more attributes selected)