Example: Car Evaluation
This is an example of a DEX model for the evaluation of cars. This is a small and simple model used to illustrate the main concepts of DEX modeling, and is not meant to address the problem of car evaluation at any realistic level. This model has been traditionally handed out together with all versions of DEX software.
Tree of Attributes
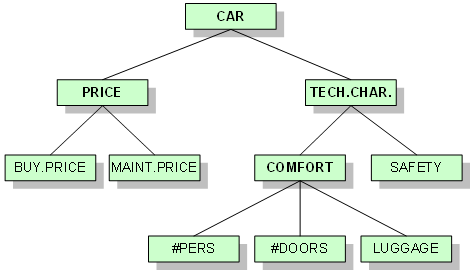
The Car Evaluation model has the following tree structure of attributes:
The same structure, displayed in a typical DEX way with descriptions of attributes:
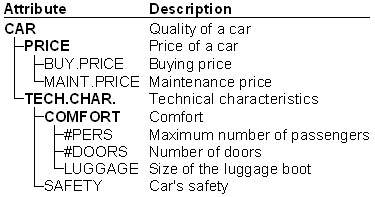
This tree of attributes can be interpreted as follows:
Decomposition: In order to evaluate a CAR, we consider its PRICE and TECHnical CHARacteristics. PRICE is further decomposed into BUYing PRICE and MAINTenance PRICE. Similarly, TECH.CHAR. are decomposed into COMFORT and SAFETY, and COMFORT is further decomposed into the number of PERSons (passengers), number of DOORS and size of the LUGGAGE boot.
Dependency: The attribute CAR depends on PRICE and TECH.CHAR. Similarly, COMFORT depends of #PERS, #DOORS and LUGGAGE. Etc.
Aggregation: The values of #PERS, #DOORS and LUGGAGE are aggregated into a value of COMFORT. Then, in the following order, BUY.PRICE and MAINT.PRICE are aggregated into PRICE, COMFORT and SAFETY are aggregated into TECH.CHAR., and PRICE and TECH.CHAR. are aggregated into CAR.
The attributes in this tree are of the following types:
Basic attributes are: BUY.PRICE, MAINT.PRICE, #PERS, #DOORS, LUGGAGE and SAFETY
Aggregate attributes are: CAR, PRICE, TECH.CHAR. and COMFORT.
The root attribute is CAR.
Scales
The scales of attributes are defined as follows:
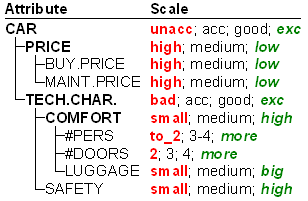
Note that all scales are qualitative and preferentially ordered ascendingly, i.e., from bad (red) to good (green) values.
Aggregation Functions
The Car Evaluation model contains only qualitative attributes. Therefore, all functions in the model are aggregation functions, represented in the form of decision tables.
Consider the root attribute CAR. According to the tree of attributes, CAR depends on lower-level attributes: PRICE and TECH.CHAR. Thus, the corresponding aggregation function maps all the combinations of values of PRICE and TECH.CHAR. into the values of CAR. The function is defined by the following decision table:
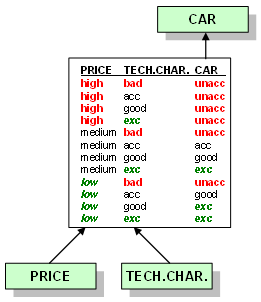
The attributes PRICE and TECH.CHAR. have three and four values, respectively, so the number of rows in the table is 3×4=12. Each row provides a value of CAR for one combination of the values of PRICE and TECH.CHAR. Interpreted as an elementary decision rule, the fourth row, for example, means the following:
if PRICE=medium and TECH.CHAR.=bad then CAR=unacc.
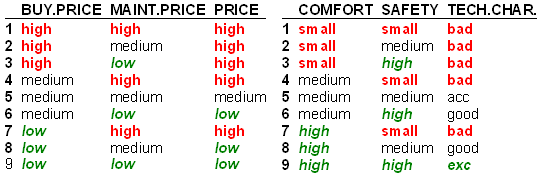
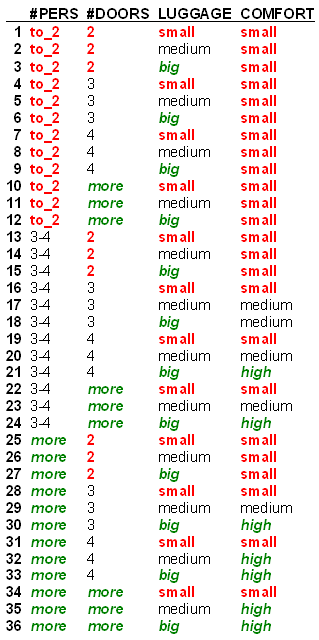
The Car Evaluation model has four aggregate attributes and, consequently, four aggregation functions. The remaining three are:
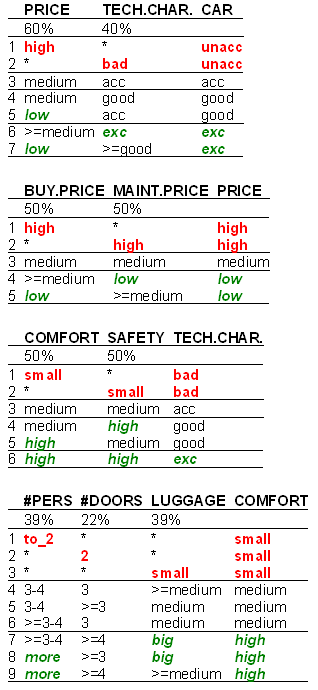
Complex Rules
The same functions, represented in terms of local weights and complex rules, look as follows:
Description and Evaluation of Cars
Alternatives evaluated by the Car Evaluation model are, obviously, cars. This example illustrates two basic concepts: description of alternatives and evaluation of alternatives.
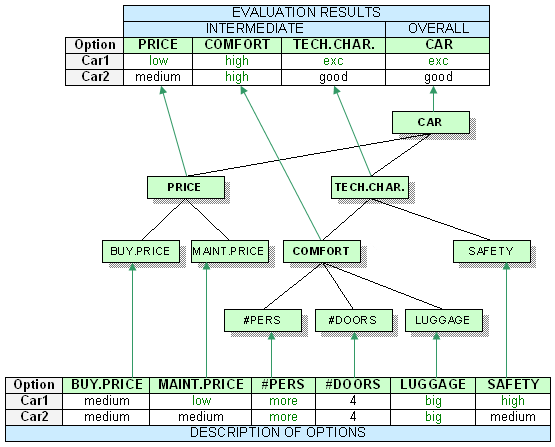
The table at the bottom shows two alternatives, Car1 and Car2, described by the qualitative values assigned to the six basic attributes.
These values are then aggregated from bottom to the top of the tree of attributes according to the structure of the tree and defined aggregation functions. In this way, intermediate evaluation results are first obtained and assigned to the attributes PRICE, COMFORT and TECH.CHAR. (see the table at the top). Finally, the values of PRICE and TECH.CHAR. are aggregated into CAR, giving the overall evaluation of both cars.
Some Analyses of Cars
This example shows some analysis reports that can be obtained in DEXi software.
Plus-minus-1 analysis
This example shows results of “Plus-minus-1 analysis” for the alternative Car2 and the aggregate attribute CAR. The column Car2 displays the current values of Car2. The column -1 displays the values of the attribute CAR when each corresponding lower-level attribute’s value changes by one step down (independently of other attributes). Similarly, the column +1 shows the effects of increasing the value by one step up. Empty fields denote no effect, and the brackets ‘[’ and ‘]’ indicate that the attribute value cannot be decreased or increased, respectively.
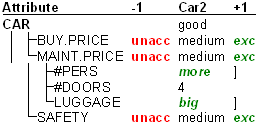
The above display shows, for example, that BUY. PRICE considerably affects the evaluation of Car2. When BUY. PRICE decreases by one step (from ‘medium’ to ‘high’; the latter value is not shown), the overall value of CAR becomes ‘unacc’. In the other direction (from ‘medium’ to ‘low’), the overall evaluation improves to ‘exc’.
The two brackets ‘]’ indicate that the values of corresponding attributes, #PERS and LUGGAGE, cannot be increased any more, preventing the +1 part of the analysis.
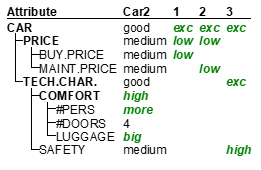
Selective explanation
Selective explanation highlights particular advantages and disadvantages of an alternative. The method finds and displays only those connected sub-trees of attributes for which the alternative has been evaluated as particularly good or bad.
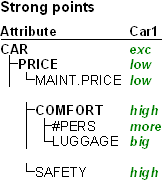
This example shows that Car2 has three particularly strong parts (two sub-trees and one single attribute):
overall evaluation, which is strongly influenced by low MAINT. PRICE,
COMFORT due to very good #PERS and LUGGAGE, and
high SAFETY.
Compare alternatives
This analysis compares one (primary) alternative with one or more other selected (secondary) alternatives, displaying all values of the primary alternative and only those values of the secondary alternatives that differ from the primary’s ones.
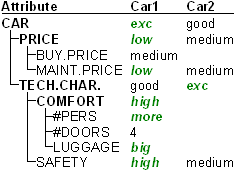
This example compares Car1 (primary alternative) with Car2 (secondary alternative). Car2 differs from Car1 in the values of basic attributes MAINT. PRICE and SAFETY, which cause different evaluations of TECH. CHAR, PRICE and CAR.
Target Analysis
Target analysis (called “Option Generator” in DEXi) tries to find the smallest changes of input values that improve or degrade the value of some selected aggregate attribute. The following are the results of target analysis finding the ways to improve Car2’s overall evaluation from good to exc:
There are three possible ways of improvement:
lowering BUY.PRICE from medium to low
lowering MAINT.PRICE from medium to low
improving SAFETY from medium to high
Charts
This example shows some charts that can be obtained in DEXi. The charts differ in the number of evaluation dimensions.
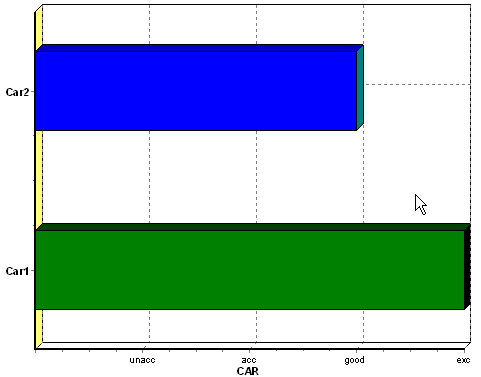
Bar Chart
This chart displays evaluation results according to one evaluation dimension. In this case, this is the root attribute CAR, so the chart shows the overall evaluation of two cars.
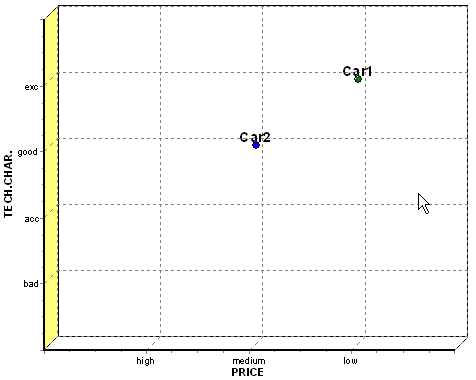
Scatter Chart
A scatter chart displays evaluation results according to two selected evaluation dimensions. In this case, the selected dimensions are PRICE and TECH.CHAR., that is, the two attributes that occur just below the root attribute CAR.
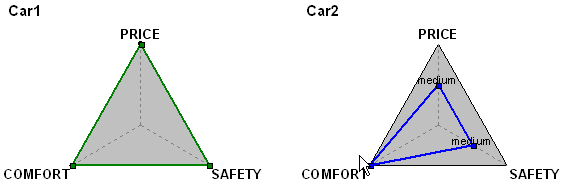
Radar Chart
Radar chart displays evaluation results according to three or more dimensions. The next chart shows the evaluation of cars using the three attributes PRICE, COMFORT and SAFETY.