Function Chart
Function Chart displays the current function edited in the Aggregation Function Editor using a three-dimensional chart. The function is displayed in a point-by-point way, where each colored dot represents one decision rule. Points are connected with lines, which serve only for visualization and are not part of the function definition.
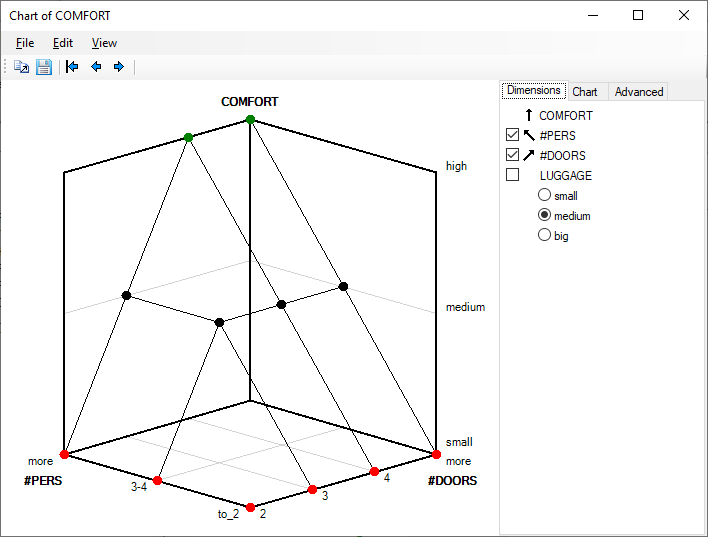
The vertical chart axis always corresponds to the output attribute. The two ground chart axes correspond to two function arguments (two input attributes). For functions that have more than two input attributes, the chart essentially displays only a three-dimensional “intersection” through the function, using two ground attributes together with fixed values of the remaining input attributes. You can select the ground attributes and the values of the remaining attributes using the Dimensions control on the right panel of the window.
Arrows, which are displayed in the control area, indicate the axes used for displaying the corresponding attribute. Clicking on an arrow, you may reverse the scale shown on that axis.
The graphical display can be altered by Chart controls on the right panel. These include:
defining picture borders [pixels],
rotation along the horizontal and vertical axes [degrees],
a button for resetting the rotation,
buttons for setting fonts, used for displaying attributes and their values.
Also, the chart can be rotated by mouse drag-and-drop on the graphic.
Commands
The following commands are available through menu items and toolbar buttons:
 File/Save chart…: Save the current chart in one of two formats:
Metafile (
File/Save chart…: Save the current chart in one of two formats:
Metafile (.emf) or Bitmap (.png).
 Edit/Copy as metafile…: Copy the current graphic to the clipboard using the metafile format.
 Edit/Copy as bitmap…: Copy the current graphic to the clipboard using the bitmap format.
 View/First chart: In the case of multiple charts (“intersections” through the function),
move to the first chart in the series.
View/First chart: In the case of multiple charts (“intersections” through the function),
move to the first chart in the series.
 View/Previous chart: Display the previous
three-dimensional graphical “intersection” through the function.
View/Previous chart: Display the previous
three-dimensional graphical “intersection” through the function.
 View/Next chart: Display the next three-dimensional
graphical “intersection” through the function.
View/Next chart: Display the next three-dimensional
graphical “intersection” through the function.
Advanced Tab
The Advanced tab provides some additional displays of the function.
Remarks
Metafile is the Windows’ vector graphic format. Usually, metafiles work better than bitmaps when pasted to Word documents or PowerPoint presentations, because they better adapt to zooming and enlarging. On the other hand, metafiles are poorly supported in environments other than Windows.