Representing Aggregation Functions
Aggregation functions are sometimes defined with large decision tables that contain 20, 30 or more decision rules. In such cases, it is important to represent such functions in a more compact and comprehensible way. DEX software uses three such representations: using complex rules, decision trees, boundary rules and three-dimensional (3D) graphics.
Complex Rules
A more compact representation of a decision table is obtained by joining several elementary rules that have the same function value. In other words, a complex rule represents one or more elementary rules. A complex rule is characterized by using intervals in the conditional part of the rule. The underlying rule-creation algorithm belongs to the class of rule learning algorithms.
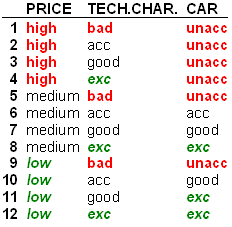
The following is the CAR aggregation function from the Car Evaluation model, represented with elementary rules:
This is the same function represented with complex rules:
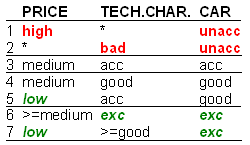
Notice that the number of rows has decreased from 12 to 7 and that symbols ‘*’ and ‘>=’ are used in the conditional part of the second table. For example, the complex rule 1 says that if PRICE is ‘high’, and regardless on the value of TECH.CHAR. (denoted ‘*’), the value of CAR is ‘unacc’. This complex rule is a compact representation of the first four elementary rules.
Decision Trees
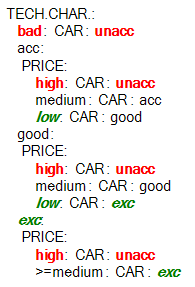
Alternatively, a decision table can be represented by a decision tree. Following the conditions, starting at the root of the tree (such as ‘TECH.CHAR: bad’), decision tree branches eventually lead to terminal nodes that represent the corresponding function value (‘CAR: unacc’).
Boundary Rules
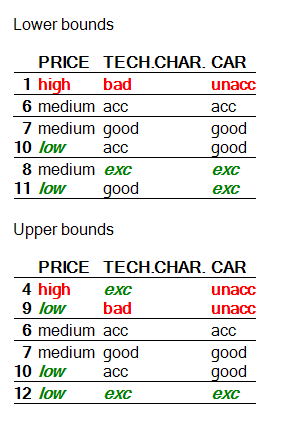
Boundary rules are determined according to the principle of dominance and consist of elementary rules that are the worst or best for a given class. Thus, boundary rules consist of two subsets of elementary rules:
Lower bounds for each of the classes. Attempting to lower any input value of such a rule is either impossible (no lower value of the correspondig attribute exists) or would imply a lower output value. In other words, lower bounds include all preferentially non-dominating elementary rules.
Upper bounds for each of the classes. Conversely, increasing any input value is impossible or implies a better output value. That is, upper bounds include all preferentially non-dominated elementary rules.
3D Graphics
Another way of representing an aggregation function is using 3D graphics. The same CAR function as above is displayed as follows.
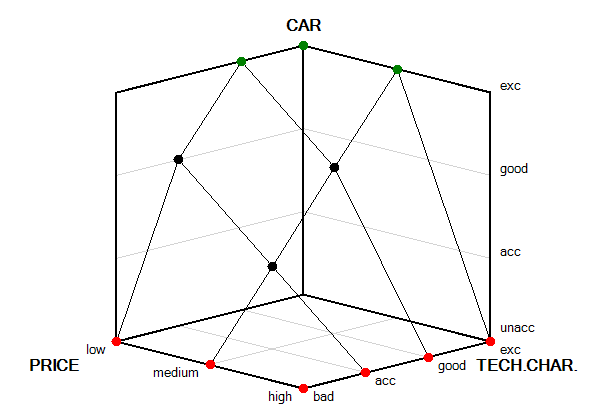
Functions that have more than two input arguments (such as PRICE and TECH.CHAR. above) are displayed as a series of 3D intersections.