Report
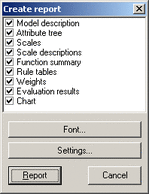
Report provides a formatted and mostly textual presentation of key components of your current DEXi model. After invoking this command, a small window appears in which you can select elements to be included in the report:

In addition to element selection, you can press one of the buttons:
Font: Specify font to be used in the report (the default is Arial, 10pt).
Settings: Open Settings/Report in order to specify the format of report and its elements.
Report: Create a report consisting of selected elements and preview it on the screen.
Cancel: Close this window without creating a report.
Also, you can right-click on the list and select one of the menu items:
 Select all reports: Select all report elements
 Unselect all reports: Clear all current selections.
Report elements
Model description: Textual description of the current model, which is optional and used only for documentation.
Attribute tree: Displays attribute names and descriptions. Tree structure is indicated by indenting and connecting attribute names. [See an example.]
Scales: Similar to ‘Attribute tree’, but displays scales. [See an example).]
Scale descriptions: A long printout of scales. For each scale in your model, it prints out the scale name, corresponding attribute description, and all scale values together with their own descriptions, if any. [This report element is rarely needed.]
Function summary: Displays the tree structure along with the status of utility functions.
Rule tables: Prints out all utility functions defined in your model. Display format is determined in Settings/Report. [See some examples].
Weights: Similar to ‘Attribute tree’, but displays attribute weights. You can explicitly select displayed weight types in Settings/Report. [See an example].
Evaluation results: Similar to ‘Attribute tree’, but displays evaluation results. Only options that are selected on the Charts Page are included into this report element. Again, its format can be determined through Settings/Report.
Chart: Prints out the chart that is currently displayed on the Charts Page.