Example: Some Car Evaluation Charts
This example shows some charts that can be obtained in DEXi from the evaluation of cars using the Car Evaluation Model. The charts differ in the number of evaluation dimensions (actually attributes) selected for presentation in DEXi’s Chart Page.
Bar Chart
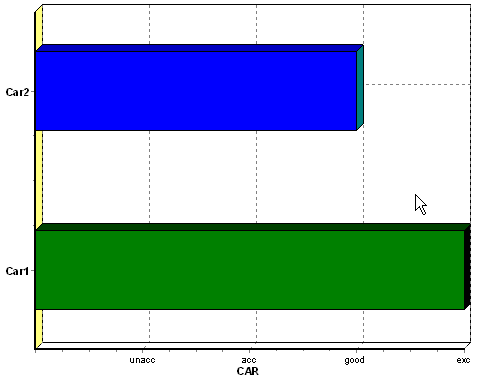
This chart displays evaluation results according to one evaluation dimension. In this case, this is the root attribute CAR, so the chart shows the overall evaluation of two cars.

Scatter Chart
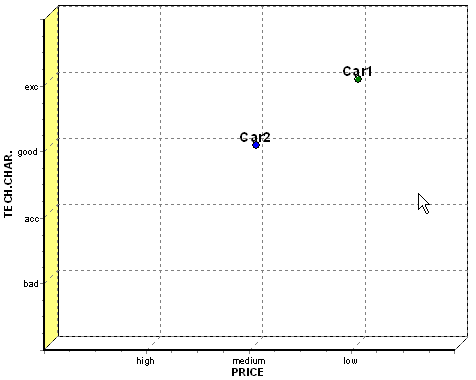
A scatter chart displays evaluation results according to two selected evaluation dimensions. In this case, the selected dimensions are PRICE and TECH.CHAR., that is, the two attributes that occur just below the root attribute CAR (see the tree structure).

Radar Chart
Radar chart displays evaluation results according to three or more dimensions. The next chart shows the evaluation of cars using the three attributes PRICE, COMFORT and SAFETY.
